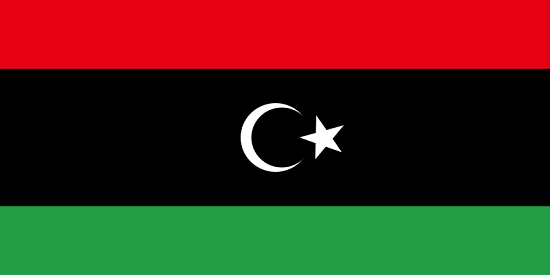
Libya

  • Chairman of the Presidential Council:Mohamed al-Menfi
  • Prime Minister:Osama Hamada
  • Capital city:Tripoli (Tarabulus)
  • Languages:Arabic (official), Italian, English (all widely understood in the major cities); Berber (Nafusi, Ghadamis, Suknah, Awjilah, Tamasheq)
  • Government
  • National statistics office
  • Population, persons:74,19,506 (2025)
  • Area, sq km:17,59,540
  • GDP per capita, US$:6,318 (2024)
  • GDP, billion current US$:46.6 (2024)
  • GINI index:No data
  • Ease of Doing Business rank:186

All datasets: A B C D E F G H I L M O Q R S T U W
  • A
    • फरवरी 2024
      Source: African Development Bank Group
      Uploaded by: Knoema
      Accessed On: 19 फरवरी, 2024
      Select Dataset
      This dataset contains data for the African countries and aggregate countries such as crude oil producers ; Sub-Saharan Africa. Data is organized under sixteen socio-economic chapters such as prices, energy, agriculture, social and AFDB aggregates which covers country scores in regional integration, social protection among others.
    • जुलाई 2025
      Source: World Bank
      Uploaded by: Alex Kulikov
      Accessed On: 10 अगस्त, 2025
      Select Dataset
      The primary World Bank collection of development indicators, compiled from officially-recognized international sources. It presents the most current and accurate global development data available, and includes national, regional and global estimates.
    • जनवरी 2025
      Source: The Africa Information Highway
      Uploaded by: Knoema
      Accessed On: 16 मई, 2025
      Select Dataset
      Data cited at: The African Development Bank: The Africa Infrastructure Development Index (AIDI): https://infrastructureafrica.opendataforafrica.org/pbuerhd https://dataportal.opendataforafrica.org/AIDI The Africa Infrastructure Development Index (AIDI) is produced by the African Development Bank. The AIDI serves a number of key objectives, principally: (i) to monitor and evaluate the status and progress of infrastructure development across the continent; (ii) to assist in resource allocation within the framework of ADF replenishments; and (iii) to contribute to policy dialogue within the Bank and between the Bank, RMCs and other development organizations.
    • नवम्बर 2020
      Source: African Child Policy Forum
      Uploaded by: Knoema
      Accessed On: 07 जनवरी, 2021
      Select Dataset
      Africa Report on Child Wellbeing - Government expenditure
  • B
    • अगस्त 2025
      Source: Bertelsmann Stiftung
      Uploaded by: Knoema
      Accessed On: 15 अगस्त, 2025
      Select Dataset
      The Bertelsmann Stiftung’s Transformation Index (BTI) analyzes and evaluates the quality of democracy, a market economy and political management in 128 developing and transition countries. It measures successes and setbacks on the path toward a democracy based on the rule of law and a market economy flanked by sociopolitical safeguards. Within this framework, the BTI publishes two rankings, the Status Index and the Management Index. Countries are further categorized on the basis of these status index and management rankings/scores. For instance, countries are categorized in to 5 groups – viz; 5 or failed, 4 or very limited, 3 or limited, 2 or advanced, and 1 or highly advanced—based on their status index score of 1 to 10. A country with a high score, 8.5 and above, is categorized as highly advanced. A country with a low score, below 4, is categorized as failed. A country is categorized as ‘very limited’ if it has a status index score between 4 and 5.5. A score between 5.5 and 7 means the country is categorized as ‘limited’ and a country is categorized as ‘advanced’ for a score between 7.1 and 8.5. On the basis of the democratic status ranking, countries are further categorized as 5 or ‘hard - line autocracies,’ 4 or ‘moderate autocracies,’ 3 or ‘highly defective democracies,’ 2 or ‘defective democracies,’ and 1 or ‘democracies in consolidation.’ A country with a democratic status ranking below 4 is categorized as a hard line autocracy. A democratic status score between 4 and 5 means that the country is part of the ‘moderate autocracy’ group. A country is grouped as a ‘highly defective democracy’ for a score between 5 and 6. A country is recognized as a ‘defective democracy’ for a score between 6 and 8, and a score of 8 and above earns a country the status of a ‘democracy in consolidation.’ Countries are also categorized in to 5 groups based on their market economy status ranking. The countries are categorized as ‘rudimentary’ or group 5, ‘poorly functioning’ or group 4, ‘functional flaws’ or group 3, ‘functioning’ or group 2, and ‘developed’ or group 1. A country is recognized as a member of the ‘developed’ group with a market economy status ranking/score of 8 and above. A country is grouped as ‘functioning’ if it has a score between 7 and 8. A market economy status ranking between 5 and 7 means the country is categorized to group 3 or the ‘functional flaws’ group. A score between 3 and 5 means that the country is ‘poorly functioning’ and a score below 3 means the country enjoys a ‘rudimentary’ status. Based on the management index ranking, countries are categorized as 5 or failed, 4 or weak, 3 or moderate, 2 or good, and1 or very good. A country is categorized as ‘very good’ for a score of 7 and above. It is categorized as ‘good’ for a score between 5.6 and 7, and as ‘moderate’ for a score between 4.4 and 5.5. A score between 3 and 4.3 means a country is categorized as ‘weak,’ and a score below 3 means the categorization of a country as ‘failed.’ Countries are ranked between 1 and 10 on the basis of the level of difficulty they face. The level of difficulty is further categorized as 5 or negligible, 4 or minor, 3 or moderate, 2 or substantial, and 1 or massive. A score of 8.5 and above means the categorization of the country’s level of difficulty as ‘massive, and a score below 2.5 means the categorization of the level of difficulty faced by the country as ‘negligible.’ The level of difficulty score of 2.5 to 4.4 means a country faces a ‘minor’ level of difficulty and a score between 4.5 and 6.4 means the level of difficulty faced by a country is ‘moderate.’ A country with a score of 6.5 to 8.4 faces a ‘substantial’ level of difficulty.
  • C
    • अगस्त 2025
      Source: National Bureau of Statistics, Nigeria
      Uploaded by: Knoema
      Accessed On: 25 अगस्त, 2025
      Select Dataset
    • मई 2025
      Source: Common Market for Eastern and Southern Africa
      Uploaded by: Knoema
      Accessed On: 19 जून, 2025
      Select Dataset
      Data cited at: https://comstat.comesa.int/FDI2016V1
    • अगस्त 2025
      Source: Common Market for Eastern and Southern Africa
      Uploaded by: Alex Kulikov
      Accessed On: 18 अगस्त, 2025
      Select Dataset
    • अगस्त 2025
      Source: International Monetary Fund
      Uploaded by: Knoema
      Accessed On: 29 अगस्त, 2025
      Select Dataset
      Data cited at: Consumer price indexes, The International Monetary Fund Consumer price indexes (CPIs) are index numbers that measure changes in the prices of goods and services purchased or otherwise acquired by households, which households use directly, or indirectly, to satisfy their own needs and wants. In practice, most CPIs are calculated as weighted averages of the percentage price changes for a specified set, or ‘‘basket’’, of consumer products, the weights reflecting their relative importance in household consumption in some period. CPIs are widely used to index pensions and social security benefits. CPIs are also used to index other payments, such as interest payments or rents, or the prices of bonds. CPIs are also commonly used as a proxy for the general rate of inflation, even though they measure only consumer inflation. They are used by some governments or central banks to set inflation targets for purposes of monetary policy. The price data collected for CPI purposes can also be used to compile other indices, such as the price indices used to deflate household consumption expenditures in national accounts, or the purchasing power parities used to compare real levels of consumption in different countries.
    • मार्च 2022
      Source: The Country Policy and Institutional Assessment, African Development Bank
      Uploaded by: Alex Kulikov
      Accessed On: 22 मार्च, 2022
      Select Dataset
      Data cited at:  The African Development Bank: Dataset name: Country Policy and Institutional Assessment (CPIA) - https://cpia.afdb.org/?page=data
    • जुलाई 2025
      Source: Numbeo
      Uploaded by: Alex Kulikov
      Accessed On: 15 जुलाई, 2025
      Select Dataset
      Data cited at: Numbeo Methodology: The Index has been calculated twice per year by considering the latest 36 months. A). Beginning of the Year and B). Mid Year Crime Index is an estimation of the overall level of crime in a given city or a country. We consider crime levels lower than 20 as very low, crime levels between 20 and 40 as being low, crime levels between 40 and 60 as being moderate, crime levels between 60 and 80 as being high and finally crime levels higher than 80 as being very high. Safety index is, on the other way, quite the opposite of crime index. If the city has a high safety index, it is considered very safe.
  • D
    • फरवरी 2021
      Source: National Institute of Statistics, Cameroon
      Uploaded by: Knoema
      Accessed On: 02 मार्च, 2021
      Select Dataset
      Data cited at: https://cameroon.opendataforafrica.org/vszafdc Demographic Statistics of African countries  
  • E
  • F
    • जनवरी 2025
      Source: National Institute of Statistics of Rwanda
      Uploaded by: Alex Kulikov
      Accessed On: 19 मार्च, 2025
      Select Dataset
    • नवम्बर 2024
      Source: National Institute of Statistics of Djibouti
      Uploaded by: Knoema
      Accessed On: 04 मार्च, 2025
      Select Dataset
      Foreign Trade of Djibouti
    • जनवरी 2025
      Source: National Bank of Ethiopia
      Uploaded by: Alex Kulikov
      Accessed On: 13 फरवरी, 2025
      Select Dataset
      Direction of Trade of Ethiopia. Note: Date 2018/19 took as 2019 while considering quarterly dates. 
    • जुलाई 2025
      Source: National Institute of Statistics, Mali
      Uploaded by: Alex Kulikov
      Accessed On: 11 जुलाई, 2025
      Select Dataset
    • अगस्त 2025
      Source: Namibia Statistics Agency
      Uploaded by: Knoema
      Accessed On: 26 अगस्त, 2025
      Select Dataset
      Foreign Trade Statistics of Namibia
    • मार्च 2025
      Source: Central Bank of Sudan
      Uploaded by: Alex Kulikov
      Accessed On: 25 मार्च, 2025
      Select Dataset
    • जुलाई 2025
      Source: Uganda Bureau of Statistics
      Uploaded by: Knoema
      Accessed On: 05 अगस्त, 2025
      Select Dataset
    • अगस्त 2025
      Source: Freedom House
      Uploaded by: Alex Kulikov
      Accessed On: 21 अगस्त, 2025
      Select Dataset
      Freedom Status obtained by Combined Average of the Political Rights and Civil Liberties Ratings (Freedom Rating) Range 1-7; 1-2.5 Free; 3-5: Partly Free and 5.5-7: Not Free The score for the A. Electoral Process subcategory The score for the B. Political Pluralism and Participation subcategory The score for the C. Functioning of Government subcategory The score for the Political Rights category The score for the D. Freedom of Expression and Belief subcategory The score for the E. Associational and Organizational Rights subcategory The score for the F. Rule of Law subcategory The score for the G. Personal Autonomy and Individual Rights subcategory The score for the Civil Liberties category Total aggregate Score for all categories  
  • G
    • फरवरी 2021
      Source: Collaborative Africa Budget Reform Initiative
      Uploaded by: Knoema
      Accessed On: 02 मार्च, 2021
      Select Dataset
      African Country Budgets, Key Indicators CABRI provides up-to-date and regular information and analysis on African national budgets.
    • जनवरी 2021
      Source: Germanwatch
      Uploaded by: Knoema
      Accessed On: 25 जनवरी, 2021
      Select Dataset
      Data cited at: Germanwatch-https://www.germanwatch.org/en/cri 
    • दिसम्बर 2020
      Source: World Economic Forum
      Uploaded by: Alex Kulikov
      Accessed On: 28 दिसम्बर, 2020
      Select Dataset
      Data cited at: The World Economic Forum https://www.weforum.org/ Topic: The Global Competitiveness Report Publication URL: https://www.weforum.org/reports/the-global-competitiveness-report-2020 License: https://creativecommons.org/licenses/by-nc-nd/4.0/legalcode
    • अप्रैल 2024
      Source: DHL
      Uploaded by: Alex Kulikov
      Accessed On: 03 मई, 2024
      Select Dataset
      DHL Global Connectedness Report, released in partnership with New York University’s Stern School of Business, unveils a remarkable finding: Globalization reached a record high in 2022 and has remained near that level in 2023
    • दिसम्बर 2019
      Source: Global Entrepreneurship and Development Institute
      Uploaded by: Knoema
      Accessed On: 20 जनवरी, 2020
      Select Dataset
      Global Entrepreneurship Index provides information about global entrepreneurship sub Index ranks and scoring of all countries. It also provides information about certain indicators like attitudes, abilities and aspirations with their ranks and scores
    • सितम्बर 2024
      Source: Global Hunger Index
      Uploaded by: Knoema
      Accessed On: 11 अक्तूबर, 2024
      Select Dataset
      Global Hunger Index, 2024 The 2024 Global Hunger Index (GHI) score for the world is 18.3, considered moderate, down only slightly from the 2016 score of 18.8. This global score obscures wide variations in hunger by region. The situation is most severe in Africa South of the Sahara and South Asia, where hunger remains serious. Africa South of the Sahara’s high GHI score is driven by the highest undernourishment and child mortality rates of any region by far. In South Asia, serious hunger reflects rising undernourishment and persistently high child undernutrition, driven by poor diet quality, economic challenges, and the increasing impact of natural disasters.
    • सितम्बर 2024
      Source: Global Innovation Index
      Uploaded by: Knoema
      Accessed On: 07 अक्तूबर, 2024
      Select Dataset
      The Global Innovation Index 2024 captures the innovation ecosystem performance of 133 economies and tracks the most recent global innovation trends. The Global Innovation Tracker 2024 provides a comprehensive analysis of the current state of global innovation. Findings highlight progress as well as challenges across four key stages of the innovation cycle: science and innovation investment, technological progress, technology adoption, and the socioeconomic impact of innovation.
    • जून 2024
      Source: Institute for Economics and Peace
      Uploaded by: Alex Kulikov
      Accessed On: 20 जून, 2024
      Select Dataset
      Data cited at: Institute for Economics and Peace retrieved from Vision of Humanity  The Global Peace Index 2022
    • दिसम्बर 2024
      Source: SolAbility
      Uploaded by: Knoema
      Accessed On: 24 दिसम्बर, 2024
      Select Dataset
      Highlights of the  Global Sustainable Competitiveness Report 2024:The GSCI is now based on a new calculation methodology incorporating 216 quantitative indicators that uses (but is not based upon) AI tools to clean data, and analyse trends and correlations • Scandinavia continues to make its mark on the Sustainable Competitiveness Index: of the top 5 spots, 4 are Scandinavian. Sweden keeps topping the Index, followed by Finland and Denmark; • Northern European countries dominate the top 20 rankings; • Only two countries in the Top 20 are not European: Japan on 10, and South on 16; • China is ranked 28, exceling in Intellectual Capital but lags in Natural Capital and Resource Efficiency, albeit with encouraging signs of efficiency improvements; • The USA is ranked 35, performing comparatively poor in resource efficiency and social capital, reflecting a decline that could potentially undermine the global status of the US in the future; • Germany ranks 9, France 8, and the UK 14; • Brazil ranks 52, India 90, and Nigeria – Africa’s most populous nation – 145; • Some of the least developed nations have a considerable higher GSCI ranking than their GDP would suggest (e.g. Vietnam, Colombia, Peu, Nepal, Bhutan, Bolivia, …) • Asian nations (South Korea, Japan, Singapore, and China) lead the Intellectual Capital Index – the basis of innovation. • The Social Capital Index ranking is headed by Northern European (Scandinavian) countries, the result of economic growth combined with a commonly accepted social consensus • Countries savaged by violent conflicts (Sudan, Yemen, Eritrea, Libya, Somalia, Afghanistan) are at the bottom of the GSCI
    • फरवरी 2025
      Source: Institute for Economics and Peace
      Uploaded by: Knoema
      Accessed On: 12 मार्च, 2025
      Select Dataset
      Data cited at:  Institute for Economics & Peace and available from http://visionofhumanity.org/reports Note: The Year of data has been considered as year of publication, for example 2020 report is considered as year 2020.   The Global Terrorism Index (GTI) is a comprehensive study which accounts for the direct and indirect impact of terrorism in 163 countries in terms of its effect on lives lost, injuries, property damage and the psychological aftereffects of terrorism. This study covers 99.6 per cent of the world's population. It aggregates the most authoritative data source on terrorism today, the Global Terrorism Database (GTD) collated by the National Consortium for the Study of Terrorism and Responses to Terrorism (START) into a composite score in order to provide an ordinal ranking of nations on the negative impact of terrorism. The GTD is unique in that it consists of systematically and comprehensively coded data on domestic as well as international terrorist incidents and now includes more than 140,000 cases.  
  • H
    • मार्च 2024
      Source: United Nations Development Programme
      Uploaded by: Knoema
      Accessed On: 10 अप्रैल, 2024
      Select Dataset
      Data Cited at: UNITED NATIONS DEVELOPMENT PROGRAMME, Human Development Data Center The Human Development Index (HDI) is a summary measure of achievements in three key dimensions of human development: a long and healthy life, access to knowledge and a decent standard of living. The HDI is the geometric mean of normalized indices for each of the the three dimensions.
  • I
    • अगस्त 2025
      Source: Heritage Foundation
      Uploaded by: Knoema
      Accessed On: 29 अगस्त, 2025
      Select Dataset
      Data cited at: Heritage Foundation   Economic freedom is the fundamental right of every human to control his or her own labor and property. In an economically free society, individuals are free to work, produce, consume, and invest in any way they please, with that freedom both protected by the state and unconstrained by the state. In economically free societies, governments allow labor, capital and goods to move freely, and refrain from coercion or constraint of liberty beyond the extent necessary to protect and maintain liberty itself. Economic Freedom Scores: Range and level of freedom 80–100:- Free 70–79.9:- Mostly Free 60–69.9:- Moderately Free 50–59.9:- Mostly Unfree 0–49.9:- Repressed
    • अक्तूबर 2024
      Source: Property Rights Alliance
      Uploaded by: Knoema
      Accessed On: 24 अक्तूबर, 2024
      Select Dataset
      The 2022 IPRI classifies 129 countries, representing 93.91% of the world population and 97.73% of the global GDP. The selection of countries was determined solely by the availability of sufficient data. The results continue to suggest that countries with high scores on the IPRI and its components also show high levels of income and development, indicating the positive relationship between a property rights regime and quality of life. The average score of the IPRI for 2022 is  5.19, where the Legal and Political Environment (LP) was the weakest component with a score of 5.06, followed by the Intellectual Property Rights (IPR) component with a score of 5.24; and quite close, the Physical Property Rights (PPR) was the strongest component with a score of 5.27  For the fourth consecutive year, we found a decrease in the overall score of the IPRI and this year, also for all of its components. Finland leads the IPRI (8.17) as well as its PPR component (8.53), while New Zealand leads the LP (8.76) and the USA the IPR component (8.73). Singapore ranks 2nd in its IPRI score (7.97) followed by Switzerland (7.94) and New Zealand (7.93).  
  • L
    • नवम्बर 2024
      Source: National Bureau of Statistics, Nigeria
      Uploaded by: Knoema
      Accessed On: 29 नवम्बर, 2024
      Select Dataset
      Abridged Labor Force Survey Under Covid-19 
    • फरवरी 2023
      Source: Legatum Institute
      Uploaded by: Knoema
      Accessed On: 27 मार्च, 2023
      Select Dataset
    • अप्रैल 2023
      Source: World Bank
      Uploaded by: Knoema
      Accessed On: 22 मई, 2023
      Select Dataset
      The Logistics Performance Index overall score reflects assessments of a country's logistics based on efficiency of the customs clearance process, quality of trade- and transport-related infrastructure, ease of arranging competitively priced shipments, quality of logistics services, ability to track and trace consignments, and frequency with which shipments reach the consignee within the scheduled time. The index ranges from 1 to 5, with a higher score representing better performance. Data are from Logistics Performance Index surveys conducted by the World Bank in partnership with academic and international institutions and private companies and individuals engaged in international logistics. 2011 round of surveys covered more than 6,000 country assessments by nearly 1,000 international freight forwarders. Respondents evaluated eight markets on six core dimensions using a scale from 1 (worst) to 5 (best). The markets are chosen based on the most important export and import markets of the respondent's country, random selection, and, for landlocked countries, neighboring countries that connect them with international markets. Scores for the six areas are averaged across all respondents and aggregated to a single score using principal components analysis. Details of the survey methodology and index construction methodology are in Connecting to Compete 2012: Trade Logistics in the Global Economy (2012).
  • M
    • फरवरी 2025
      Source: The Africa Information Highway
      Uploaded by: Knoema
      Accessed On: 24 फरवरी, 2025
      Select Dataset
      Data cited at: The African Development Bank: African Economic Outlook:  https://dataportal.opendataforafrica.org/mhuiccf
    • अगस्त 2025
      Source: General Authority for Statistics, Kingdom of Saudi Arabia
      Uploaded by: Knoema
      Accessed On: 12 अगस्त, 2025
      Select Dataset
    • सितम्बर 2024
      Source: Global Knowledge Partnership on Migration and Development
      Uploaded by: Knoema
      Accessed On: 27 सितम्बर, 2024
      Select Dataset
      Migration and Remittances Fact book provides a snapshot of migration and remittances for all countries, regions and income groups of the world, compiled from available data from various sources.
  • O
  • Q
    • जनवरी 2025
      Source: Quality of Government Institute
      Uploaded by: Knoema
      Accessed On: 03 फरवरी, 2025
      Select Dataset
      The main objective of the research is to address the theoretical and empirical problems of how political institutions of high quality can be created and maintained. The second objective is to study the effects of Quality of Government on a number of policy areas, such as health, environment, social policy, and poverty. While Quality of Government is the common intellectual focal point of the research institute, a variety of theoretical and methodological perspectives are applied. Data citation:  Teorell, Jan, Aksel Sundström, Sören Holmberg, Bo Rothstein, Natalia Alvarado Pachon, Cem Mert Dalli, Rafael Lopez Valverde, Victor Saidi Phiri & Lauren Gerber. 2025. The Quality of Government Standard Dataset, version Jan25. University of Gothenburg: The Quality of Government Institute, https://www.gu.se/en/quality-government doi:10.18157/qogstdjan25
  • R
  • S
    • अगस्त 2025
      Source: Scimago Institutions Rankings
      Uploaded by: Knoema
      Accessed On: 15 अगस्त, 2025
      Select Dataset
      The SCImago Institutions Rankings (SIR) is a classification of academic and research-related institutions ranked by a composite indicator that combines three different sets of indicators based on research performance, innovation outputs and societal impact measured by their web visibility. It provides a friendly interface that allows the visualization of any customized ranking from the combination of these three sets of indicators. Additionally, it is possible to compare the trends for individual indicators of up to six institutions. For each large sector it is also possible to obtain distribution charts of the different indicators.  
    • अप्रैल 2025
      Source: United Nations Statistics Division
      Uploaded by: Knoema
      Accessed On: 22 जुलाई, 2025
      Select Dataset
  • T
  • U
    • अप्रैल 2025
      Source: UNESCO Institute for Statistics
      Uploaded by: Knoema
      Accessed On: 25 अप्रैल, 2025
      Select Dataset
      National Monitoring : School life expectancy by level of education
  • W
    • अगस्त 2024
      Source: World Economics and Politics (WEP) Dataverse
      Uploaded by: Alex Kulikov
      Accessed On: 04 सितम्बर, 2024
      Select Dataset
    • जुलाई 2025
      Source: World Bank
      Uploaded by: Knoema
      Accessed On: 27 अगस्त, 2025
      Select Dataset
      Data cited at: The World Bank https://datacatalog.worldbank.org/ Topic: Global Economic Monitor Publication: https://datacatalog.worldbank.org/dataset/global-economic-monitor License: http://creativecommons.org/licenses/by/4.0/   The dataset Provides daily updates of global economic developments, with coverage of high income- as well as developing countries. Average period data updates are provided for exchange rates, equity markets, interest rates, stripped bond spreads, and emerging market bond indices. Monthly data coverage (updated daily and populated upon availability) is provided for consumer prices, high-tech market indicators, industrial production and merchandise trade.
    • जून 2025
      Source: World Bank
      Uploaded by: Knoema
      Accessed On: 13 जून, 2025
      Select Dataset
      Global growth is expected to hold steady at 2.7 percent in 2025-26. However, the global economy appears to be settling at a low growth rate that will be insufficient to foster sustained economic development. Emerging market and developing economies are set to enter the second quarter of the 21st century with per capita incomes on a trajectory that implies feeble catch-up toward those of advanced economies. Most low-income countries are not on course to graduate to middle-income status by 2050. Policy action at the global and national levels is needed to foster a more favorable external environment, enhance macroeconomic stability, reduce structural constraints, address the effects of climate change, and thus accelerate long-term growth and development.
    • अगस्त 2025
      Source: World Bank
      Uploaded by: Alex Kulikov
      Accessed On: 03 अगस्त, 2025
      Select Dataset
      The primary World Bank collection of development indicators, compiled from officially-recognized international sources. It presents the most current and accurate global development data available, and includes national, regional and global estimates
    • मार्च 2025
      Source: Sustainable Development Solutions Network
      Uploaded by: Alex Kulikov
      Accessed On: 08 अप्रैल, 2025
      Select Dataset
      The World Happiness Report is a landmark survey of the state of global happiness that ranks 156 countries by how happy their citizens perceive themselves to be. The World Happiness Report 2020 for the first time ranks cities around the world by their subjective well-being and digs more deeply into how the social, urban and natural environments combine to affect our happiness.
    • जुलाई 2025
      Source: Economic Policy Uncertainty
      Uploaded by: Alex Kulikov
      Accessed On: 28 जुलाई, 2025
      Select Dataset
      Data cited at: World Uncertainty Index (WUI), developed by Hites Ahir (International Monetary Fund), Nicholas Bloom (Stanford University) and Davide Furceri (International Monetary Fund).