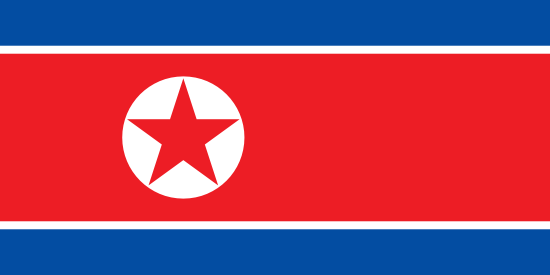
Democratic People's Republic of Korea

  • Supreme Leader:Kim Jong-un
  • Premier:Pak Thae-song
  • Capital city:Pyongyang
  • Languages:Korean
  • Government
  • National statistics office:No data
  • Population, persons:2,65,37,332 (2025)
  • Area, sq km:1,20,410
  • GDP per capita, US$:No data
  • GDP, billion current US$:No data
  • GINI index:No data
  • Ease of Doing Business rank:84

All datasets: A B C E F G H I M O Q S U W
  • A
    • जुलाई 2025
      Source: World Bank
      Uploaded by: Alex Kulikov
      Accessed On: 10 अगस्त, 2025
      Select Dataset
      The primary World Bank collection of development indicators, compiled from officially-recognized international sources. It presents the most current and accurate global development data available, and includes national, regional and global estimates.
    • नवम्बर 2020
      Source: Health Effects Institute
      Uploaded by: Alex Kulikov
      Accessed On: 17 दिसम्बर, 2020
      Select Dataset
  • B
    • अगस्त 2025
      Source: Bertelsmann Stiftung
      Uploaded by: Knoema
      Accessed On: 15 अगस्त, 2025
      Select Dataset
      The Bertelsmann Stiftung’s Transformation Index (BTI) analyzes and evaluates the quality of democracy, a market economy and political management in 128 developing and transition countries. It measures successes and setbacks on the path toward a democracy based on the rule of law and a market economy flanked by sociopolitical safeguards. Within this framework, the BTI publishes two rankings, the Status Index and the Management Index. Countries are further categorized on the basis of these status index and management rankings/scores. For instance, countries are categorized in to 5 groups – viz; 5 or failed, 4 or very limited, 3 or limited, 2 or advanced, and 1 or highly advanced—based on their status index score of 1 to 10. A country with a high score, 8.5 and above, is categorized as highly advanced. A country with a low score, below 4, is categorized as failed. A country is categorized as ‘very limited’ if it has a status index score between 4 and 5.5. A score between 5.5 and 7 means the country is categorized as ‘limited’ and a country is categorized as ‘advanced’ for a score between 7.1 and 8.5. On the basis of the democratic status ranking, countries are further categorized as 5 or ‘hard - line autocracies,’ 4 or ‘moderate autocracies,’ 3 or ‘highly defective democracies,’ 2 or ‘defective democracies,’ and 1 or ‘democracies in consolidation.’ A country with a democratic status ranking below 4 is categorized as a hard line autocracy. A democratic status score between 4 and 5 means that the country is part of the ‘moderate autocracy’ group. A country is grouped as a ‘highly defective democracy’ for a score between 5 and 6. A country is recognized as a ‘defective democracy’ for a score between 6 and 8, and a score of 8 and above earns a country the status of a ‘democracy in consolidation.’ Countries are also categorized in to 5 groups based on their market economy status ranking. The countries are categorized as ‘rudimentary’ or group 5, ‘poorly functioning’ or group 4, ‘functional flaws’ or group 3, ‘functioning’ or group 2, and ‘developed’ or group 1. A country is recognized as a member of the ‘developed’ group with a market economy status ranking/score of 8 and above. A country is grouped as ‘functioning’ if it has a score between 7 and 8. A market economy status ranking between 5 and 7 means the country is categorized to group 3 or the ‘functional flaws’ group. A score between 3 and 5 means that the country is ‘poorly functioning’ and a score below 3 means the country enjoys a ‘rudimentary’ status. Based on the management index ranking, countries are categorized as 5 or failed, 4 or weak, 3 or moderate, 2 or good, and1 or very good. A country is categorized as ‘very good’ for a score of 7 and above. It is categorized as ‘good’ for a score between 5.6 and 7, and as ‘moderate’ for a score between 4.4 and 5.5. A score between 3 and 4.3 means a country is categorized as ‘weak,’ and a score below 3 means the categorization of a country as ‘failed.’ Countries are ranked between 1 and 10 on the basis of the level of difficulty they face. The level of difficulty is further categorized as 5 or negligible, 4 or minor, 3 or moderate, 2 or substantial, and 1 or massive. A score of 8.5 and above means the categorization of the country’s level of difficulty as ‘massive, and a score below 2.5 means the categorization of the level of difficulty faced by the country as ‘negligible.’ The level of difficulty score of 2.5 to 4.4 means a country faces a ‘minor’ level of difficulty and a score between 4.5 and 6.4 means the level of difficulty faced by a country is ‘moderate.’ A country with a score of 6.5 to 8.4 faces a ‘substantial’ level of difficulty.
  • C
    • अगस्त 2025
      Source: International Monetary Fund
      Uploaded by: Knoema
      Accessed On: 29 अगस्त, 2025
      Select Dataset
      Data cited at: Consumer price indexes, The International Monetary Fund Consumer price indexes (CPIs) are index numbers that measure changes in the prices of goods and services purchased or otherwise acquired by households, which households use directly, or indirectly, to satisfy their own needs and wants. In practice, most CPIs are calculated as weighted averages of the percentage price changes for a specified set, or ‘‘basket’’, of consumer products, the weights reflecting their relative importance in household consumption in some period. CPIs are widely used to index pensions and social security benefits. CPIs are also used to index other payments, such as interest payments or rents, or the prices of bonds. CPIs are also commonly used as a proxy for the general rate of inflation, even though they measure only consumer inflation. They are used by some governments or central banks to set inflation targets for purposes of monetary policy. The price data collected for CPI purposes can also be used to compile other indices, such as the price indices used to deflate household consumption expenditures in national accounts, or the purchasing power parities used to compare real levels of consumption in different countries.
  • E
  • F
    • अगस्त 2025
      Source: Fund for Peace
      Uploaded by: Knoema
      Accessed On: 05 अगस्त, 2025
      Select Dataset
      Data cited at: Fragile States Index - https://fragilestatesindex.org/ The FSI focuses on the indicators of risk and is based on thousands of articles and reports that are processed by our CAST Software from electronically available sources. Measures of fragility, like Demographic Pressures,Refugees and IDPs and etc., have been scaled on 0 to 10 where 10 is highest fragility and 0 no fragility.
  • G
    • सितम्बर 2024
      Source: Global Hunger Index
      Uploaded by: Knoema
      Accessed On: 11 अक्तूबर, 2024
      Select Dataset
      Global Hunger Index, 2024 The 2024 Global Hunger Index (GHI) score for the world is 18.3, considered moderate, down only slightly from the 2016 score of 18.8. This global score obscures wide variations in hunger by region. The situation is most severe in Africa South of the Sahara and South Asia, where hunger remains serious. Africa South of the Sahara’s high GHI score is driven by the highest undernourishment and child mortality rates of any region by far. In South Asia, serious hunger reflects rising undernourishment and persistently high child undernutrition, driven by poor diet quality, economic challenges, and the increasing impact of natural disasters.
    • सितम्बर 2024
      Source: Global Innovation Index
      Uploaded by: Knoema
      Accessed On: 07 अक्तूबर, 2024
      Select Dataset
      The Global Innovation Index 2024 captures the innovation ecosystem performance of 133 economies and tracks the most recent global innovation trends. The Global Innovation Tracker 2024 provides a comprehensive analysis of the current state of global innovation. Findings highlight progress as well as challenges across four key stages of the innovation cycle: science and innovation investment, technological progress, technology adoption, and the socioeconomic impact of innovation.
    • जून 2018
      Source: Open Knowledge International
      Uploaded by: Alex Kulikov
      Accessed On: 13 जून, 2018
      Select Dataset
  • H
    • मार्च 2024
      Source: United Nations Development Programme
      Uploaded by: Knoema
      Accessed On: 10 अप्रैल, 2024
      Select Dataset
      Data Cited at: UNITED NATIONS DEVELOPMENT PROGRAMME, Human Development Data Center The Human Development Index (HDI) is a summary measure of achievements in three key dimensions of human development: a long and healthy life, access to knowledge and a decent standard of living. The HDI is the geometric mean of normalized indices for each of the the three dimensions.
  • I
    • अगस्त 2025
      Source: Heritage Foundation
      Uploaded by: Knoema
      Accessed On: 29 अगस्त, 2025
      Select Dataset
      Data cited at: Heritage Foundation   Economic freedom is the fundamental right of every human to control his or her own labor and property. In an economically free society, individuals are free to work, produce, consume, and invest in any way they please, with that freedom both protected by the state and unconstrained by the state. In economically free societies, governments allow labor, capital and goods to move freely, and refrain from coercion or constraint of liberty beyond the extent necessary to protect and maintain liberty itself. Economic Freedom Scores: Range and level of freedom 80–100:- Free 70–79.9:- Mostly Free 60–69.9:- Moderately Free 50–59.9:- Mostly Unfree 0–49.9:- Repressed
  • M
    • सितम्बर 2024
      Source: Global Knowledge Partnership on Migration and Development
      Uploaded by: Knoema
      Accessed On: 27 सितम्बर, 2024
      Select Dataset
      Migration and Remittances Fact book provides a snapshot of migration and remittances for all countries, regions and income groups of the world, compiled from available data from various sources.
  • O
  • Q
    • जनवरी 2025
      Source: Quality of Government Institute
      Uploaded by: Knoema
      Accessed On: 03 फरवरी, 2025
      Select Dataset
      The main objective of the research is to address the theoretical and empirical problems of how political institutions of high quality can be created and maintained. The second objective is to study the effects of Quality of Government on a number of policy areas, such as health, environment, social policy, and poverty. While Quality of Government is the common intellectual focal point of the research institute, a variety of theoretical and methodological perspectives are applied. Data citation:  Teorell, Jan, Aksel Sundström, Sören Holmberg, Bo Rothstein, Natalia Alvarado Pachon, Cem Mert Dalli, Rafael Lopez Valverde, Victor Saidi Phiri & Lauren Gerber. 2025. The Quality of Government Standard Dataset, version Jan25. University of Gothenburg: The Quality of Government Institute, https://www.gu.se/en/quality-government doi:10.18157/qogstdjan25
  • S
    • अगस्त 2025
      Source: Scimago Institutions Rankings
      Uploaded by: Knoema
      Accessed On: 15 अगस्त, 2025
      Select Dataset
      The SCImago Institutions Rankings (SIR) is a classification of academic and research-related institutions ranked by a composite indicator that combines three different sets of indicators based on research performance, innovation outputs and societal impact measured by their web visibility. It provides a friendly interface that allows the visualization of any customized ranking from the combination of these three sets of indicators. Additionally, it is possible to compare the trends for individual indicators of up to six institutions. For each large sector it is also possible to obtain distribution charts of the different indicators.  
    • जून 2024
      Source: Sustainable Development Solutions Network
      Uploaded by: Knoema
      Accessed On: 19 जून, 2024
      Select Dataset
      Data Cited at - Sachs, J., Schmidt-Traub, G., Kroll, C., Lafortune, G., Fuller, G. (2019): Sustainable Development Report 2019. New York: Bertelsmann Stiftung and Sustainable Development Solutions Network (SDSN). The Sustainable Development Report 2020 presents the SDG Index and Dashboards for all UN member states and frames the implementation of the Sustainable Development Goals (SDGs) in terms of six broad transformations. It was prepared by teams of independent experts at the Sustainable Development Solutions Network (SDSN) and the Bertelsmann Stiftung.
    • अप्रैल 2025
      Source: United Nations Statistics Division
      Uploaded by: Knoema
      Accessed On: 22 जुलाई, 2025
      Select Dataset
  • U
    • सितम्बर 2024
      Source: United Nations Public Administration Country Studies
      Uploaded by: Knoema
      Accessed On: 04 अक्तूबर, 2024
      Select Dataset
      Data cited at: UN E-Government Knowledgebase - https://publicadministration.un.org/egovkb/en-us/ 1. The EGDI is based on a comprehensive Survey of the online presence of all 193 United Nations Member States, which assesses national websites and how e-government policies and strategies are applied in general and in specific sectors for delivery of essential services. The assessment rates the e-government performance of countries relative to one another as opposed to being an absolute measurement. The results are tabulated and combined with a set of indicators embodying a country’s capacity to participate in the information society, without which e-government development efforts are of limited immediate use. Although the basic model has remained consistent, the precise meaning of these values varies from one edition of the Survey to the next as understanding of the potential of e-government changes and the underlying technology evolves. This is an important distinction because it also implies that it is a comparative framework that seeks to encompass various approaches that may evolve over time instead of advocating a linear path with an absolute goal. 2. E-Government Development Index-EGDI Very High-EGDI (Greater than 0.75) High-EGDI (Between 0.50 and 0.75) Middle-EGDI (Between 0.25 and 0.50) Low-EGDI (Less than 0.25)
    • अप्रैल 2025
      Source: UNESCO Institute for Statistics
      Uploaded by: Knoema
      Accessed On: 25 अप्रैल, 2025
      Select Dataset
      National Monitoring : School life expectancy by level of education
  • W
    • अगस्त 2025
      Source: World Bank
      Uploaded by: Alex Kulikov
      Accessed On: 01 सितम्बर, 2025
      Select Dataset
      The primary World Bank collection of development indicators, compiled from officially-recognized international sources. It presents the most current and accurate global development data available, and includes national, regional and global estimates