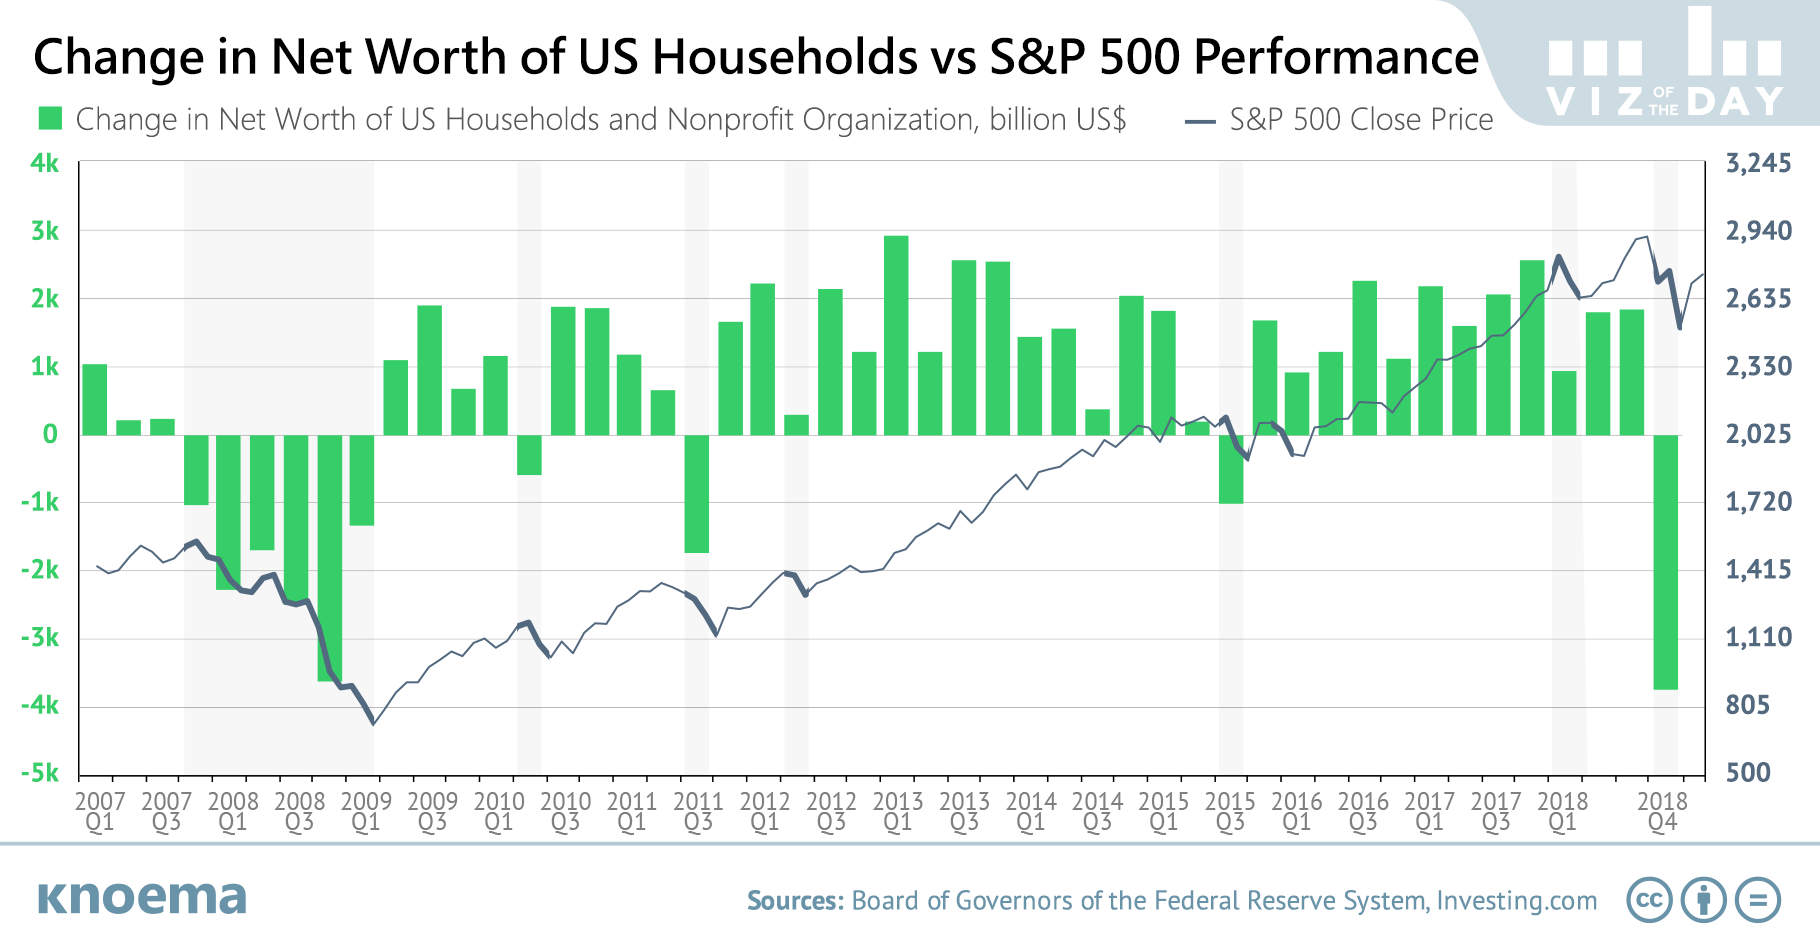
The net worth of US households tumbled 3.5 percent quarter-on-quarter during the fourth quarter of 2018, according to the US Federal Reserve. Only twice since 1952, once in 1962 and again in 2008, was a larger drop reported, and yet for most Americans it’s the proverbial tree falling in the woods: did anyone feel it?

The slump in 4Q 2018 is attributable to the poor performance of the stock market in late 2018 and the corresponding hit to the value of household holdings of corporate equities. It's a familiar story. Historically, corporate equities have caused the most volatility in US household net worth, especially in the negative direction; the value of household real estate holdings fell only during the global financial crisis of 2008.

  • The vulnerability of households to fluctuations in stocks and real estate is directly attributable to the fact that real estate and equities constitute roughly half of all US household assets. Liabilities, e.g. household debt, are dominated by home mortgages and consumer credit.

So, did Americans notice? For most part, no. Only half of all American households own stocks and nearly 80 percent of all wealth in the US is owned by just 10 percent of the population. For these 10 percent, ultra-rich households, movements of stock indices reflect real changes to their net worth and they are looking to recover in 2019 (or at least before retirement); for the rest of Americans, this was a blip of little direct consequence.


संबंधित जानकारी Knoema से

The High Burden of US Housing Costs

Housing represents a growing source of budgetary pressure for Americans, and the data suggests American's desire for space is at least partially to blame. In 2017, housing represented 33 percent of total US household expenditures, with rent and mortgage—as compared to other household expenses like furnishings and utilities—making up about 60 percent of the household budget, according to the US Bureau of Labor Statistics. Renters have been particularly hard hit, with more than 40 percent spending 35 percent or more of their income on housing. While only about 20 percent of mortgage...

US Student Loan Debt Accumulation Showing No Signs of Slowing

(January 19, 2019) Student loans in the United States represent the second largest type of household debt after home mortgages and were not only impervious to the 2009 recession, but are steadily rising along with total US household debt. As of the third quarter of 2018, student debt outstanding expanded by 2.6 percent, reaching a peak of $1.44 trillion, which is higher than total US auto loans and credit card debt. Total student loan debt has more than doubled since 2009 and grown six-fold over the last 15 years. The cumulative value of student loans in default has also increased,...

US Consumer Confidence Rebound Spotlights Global Discrepancies

(13 March 2019) Consumer confidence in the world's biggest economy, the United States, rebounded in February after a sharp drop in January, according to the University of Michigan. January’s decrease was the single sharpest drop in consumer sentiment since 2012 and was at least partially spurred by the partial US government shutdown. In February, the Federal Reserve signaled that it will hold off on further interest rate hikes and trade relations with China continued to thaw, bolstering the rebound. The Fed monitors the Consumer Confidence Index to help guide policy adjustments....

Household Debt in the US

The household debt balance in the United States reached a new all-time high of $13.3 trillion in the second quarter of 2018, according to the latest report from the Center for Microeconomic Data of the Federal Reserve Bank of New York. US household debt has risen continuously since 2013, now constituting 65 percent of US GDP and exceeding the 2008 pre-crisis level by nearly $475 billion. US household debt is indisputably large in absolute terms, now exceeding the GDP China, the world's second-largest economy. Yet, relative to the size of the US economy, household debt is less...